.png?v=v1)
.png?v=v1)
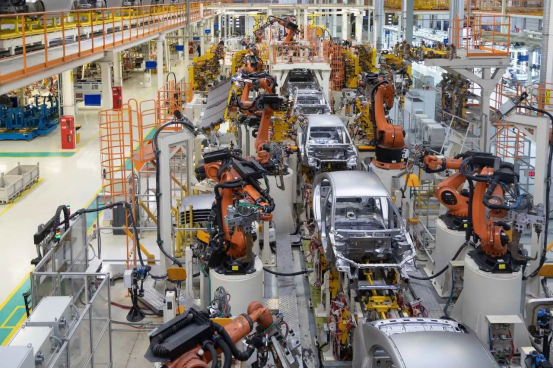
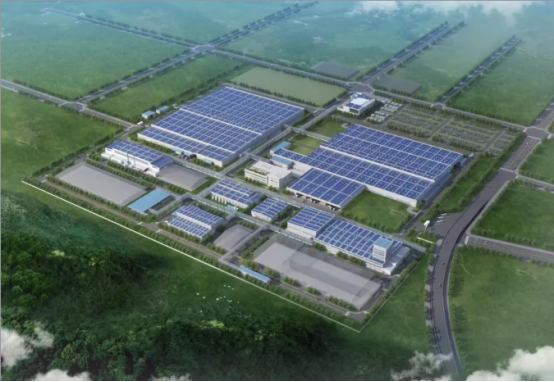
An auto parts company mainly produces key components for sedan engines and chassis, and is an important parts production base. The factory needs to build an energy management system that is independent and can share data with third-party platforms for multiple areas and the entire plant's switching stations and distribution rooms.
Sfere Energy Management System connects multiple energy consumption collection terminals through the network to implement centralized monitoring, measurement, and management of various energy consumption data. Through multidimensional energy consumption statistics and dynamic trend analysis, it helps users grasp the energy consumption trend, analyze and diagnose energy efficiency levels, identify key energy-saving points, analyze energy-saving potential, and point out the direction for enterprises to improve energy utilization efficiency.

System Introduction

Web function
24-hour energy consumption data monitoring, diversified data statistics methods, visual presentation of data trends, reliable and stable acquisition of various energy consumption data through energy management systems and intelligent monitoring equipment, reducing the cost of real-time energy consumption data acquisition, and helping users grasp energy consumption status anytime and anywhere.
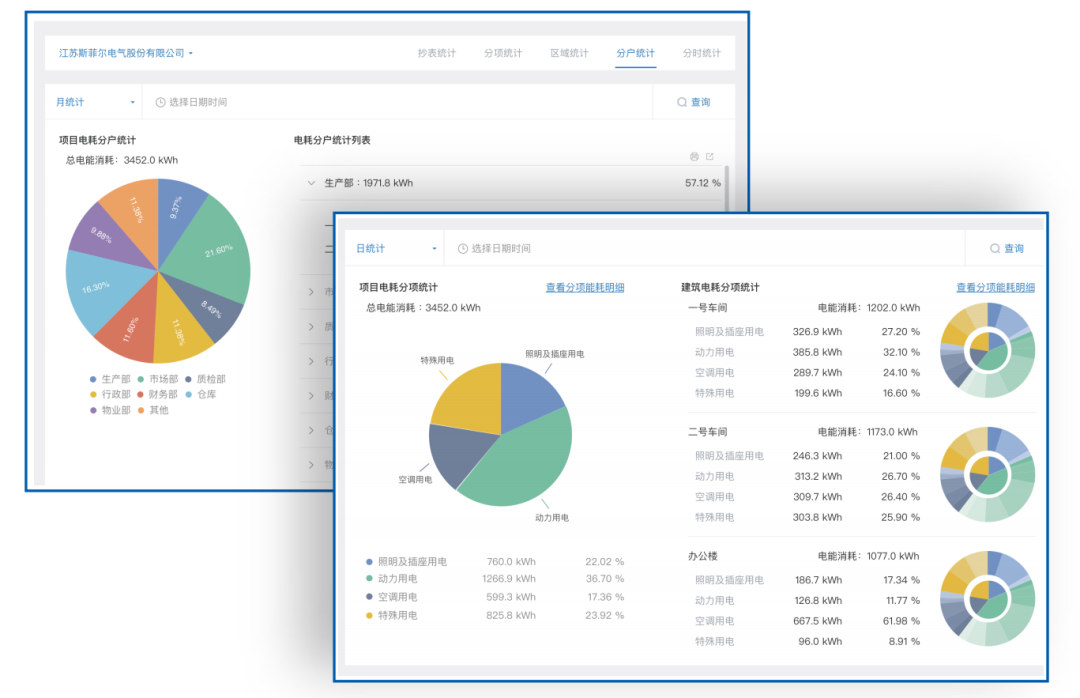
Realize the tracking and management of the whole cycle of energy supply, conversion, utilization and consumption in various scenarios, analyze various energy consumption loads and changing trends, customize the statistical report format according to the needs of users for diversified energy statistical management reports, provide energy sub-item, regional, household and other statistical dimensions data, and serve users' needs for statistical comparison and analysis. Meet the needs of energy conservation management and improve the level of energy conservation management.
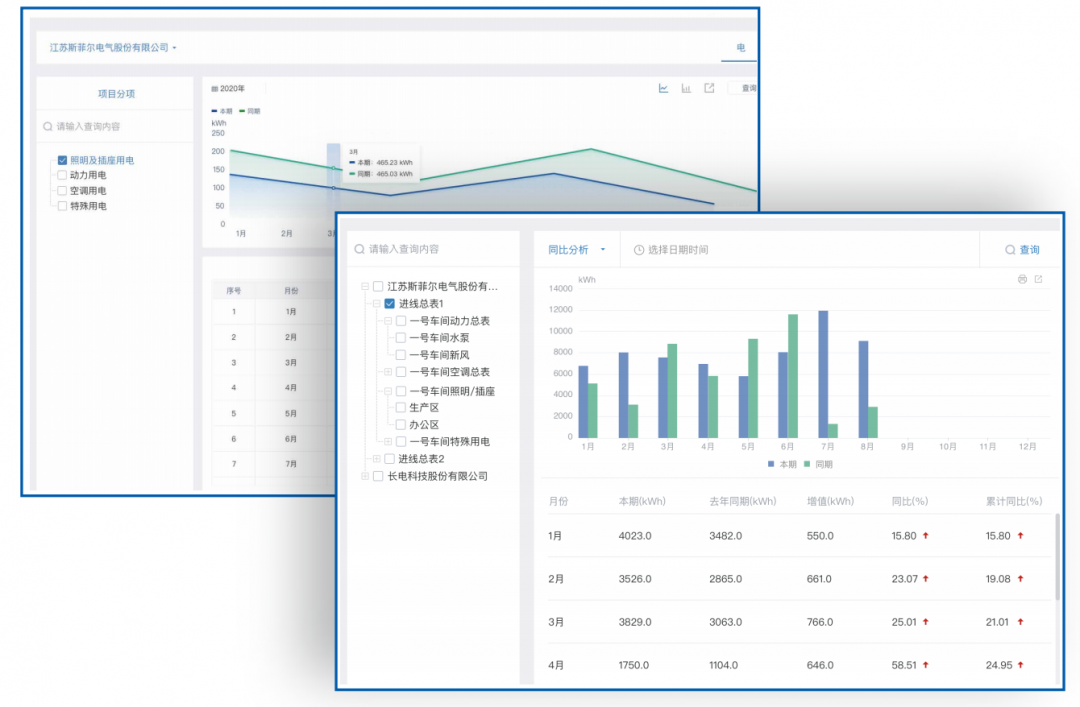
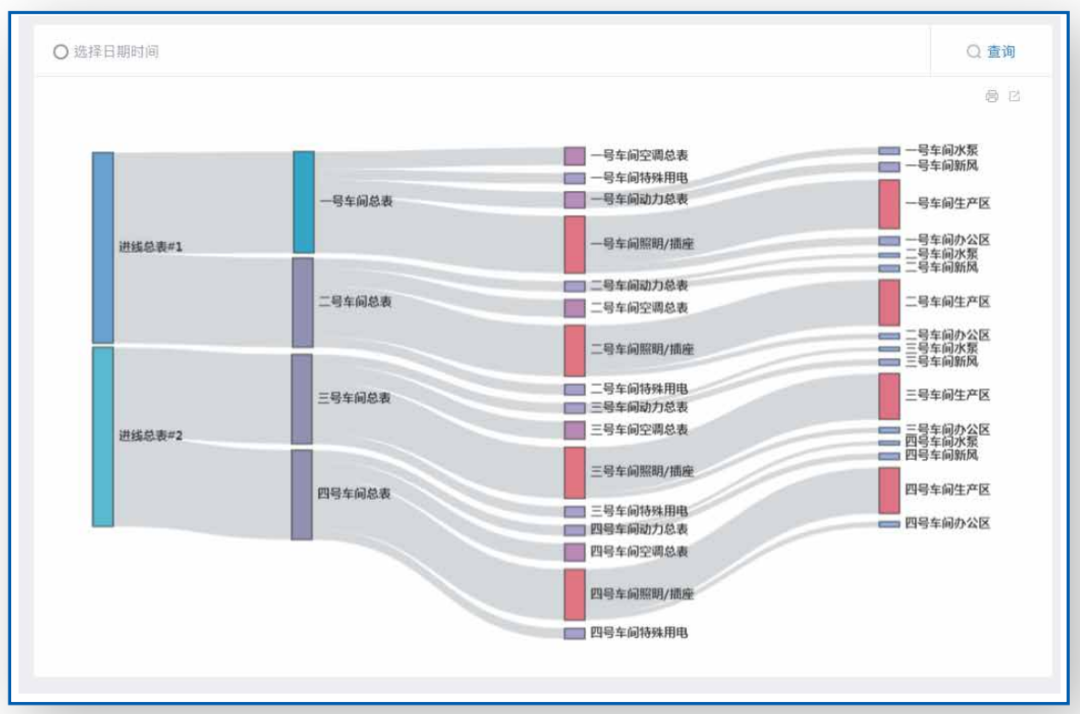
Energy flow tracing
Integrate energy consumption statistical data, sort out the direction of energy consumption, visually display monthly and annual energy consumption panorama in the form of a Sangi chart, track the historical trend of energy consumption data in each link, and comprehensively sort out the energy consumption structure of enterprises.
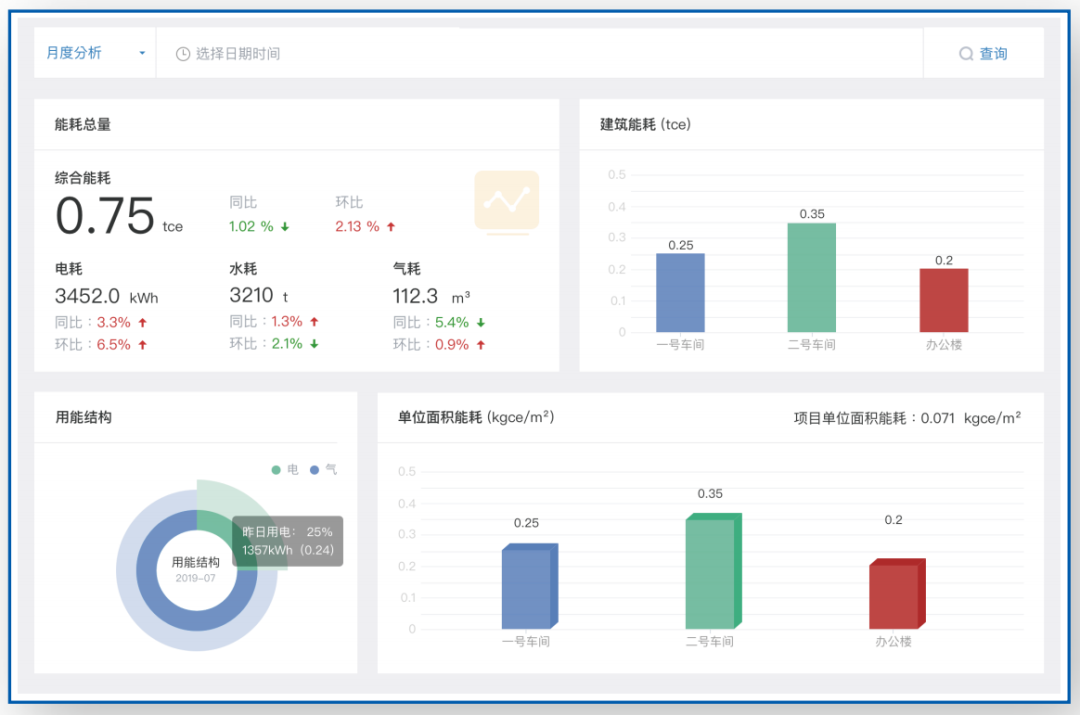
Evaluation of energy efficiency indicators
The energy efficiency benchmarking analysis of key energy consuming nodes can assist users in identifying energy-saving key points, analyzing energy-saving potential, and pointing out the direction for enterprises to improve energy utilization efficiency. The system achieves regular and automatic comparison of energy efficiency indicators through a freely and flexibly configured industry model, and analyzes the energy efficiency level of enterprises through indicators such as energy consumption structure, total energy consumption, product unit consumption, process energy consumption, and unit area energy consumption. Establish an energy efficiency warning and alarm mechanism for key indicator parameters, achieve comprehensive evaluation and assessment management, and promote further energy conservation and consumption reduction work.
Data Model Configuration
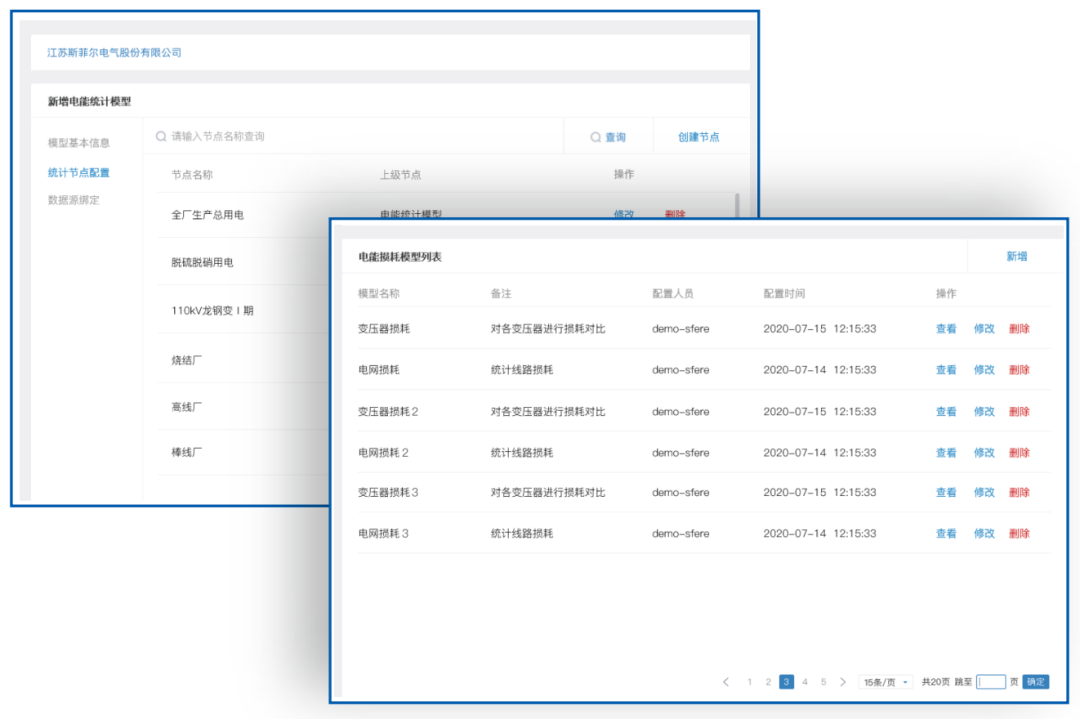
Users can customize various types of information such as statistical objects, statistical parameters, statistical ranges, and data rules according to their actual needs, and build a professional energy consumption data statistical analysis model that meets user management needs. Multiple presentation forms such as graphics and reports are used for data statistical analysis, and customized energy consumption data reports can be automatically generated.
Third party interface
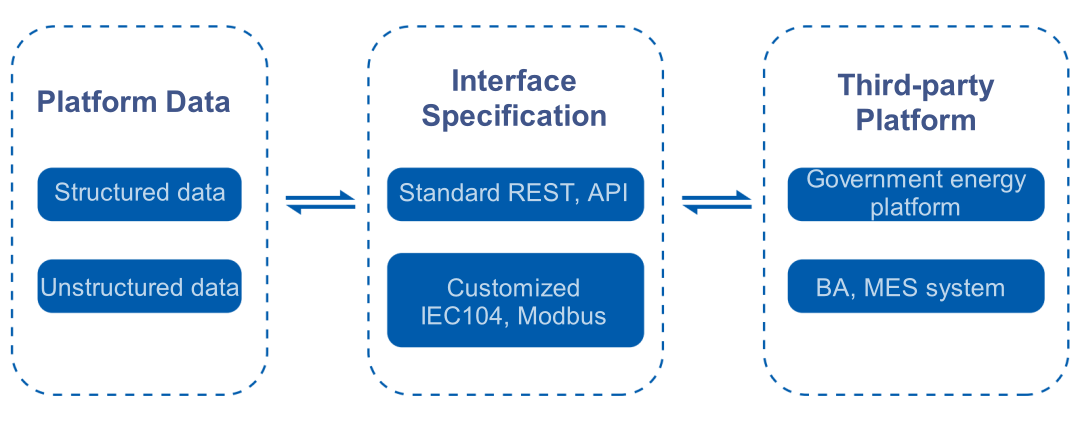
The platform provides standardized RESTful API data interfaces that can meet the data docking requirements of third-party system platforms such as government energy management platforms. At the same time, universal industrial protocols and power protocols (such as ModbusTCP, IEC104, etc.) can be customized and developed according to the actual situation of the user system to complete the collection and forwarding docking, achieve efficient, secure and multi-channel data transmission guarantee, break data silos, enhance data value, and achieve the goal of user data system docking.
APP Function
Convenient energy consumption query
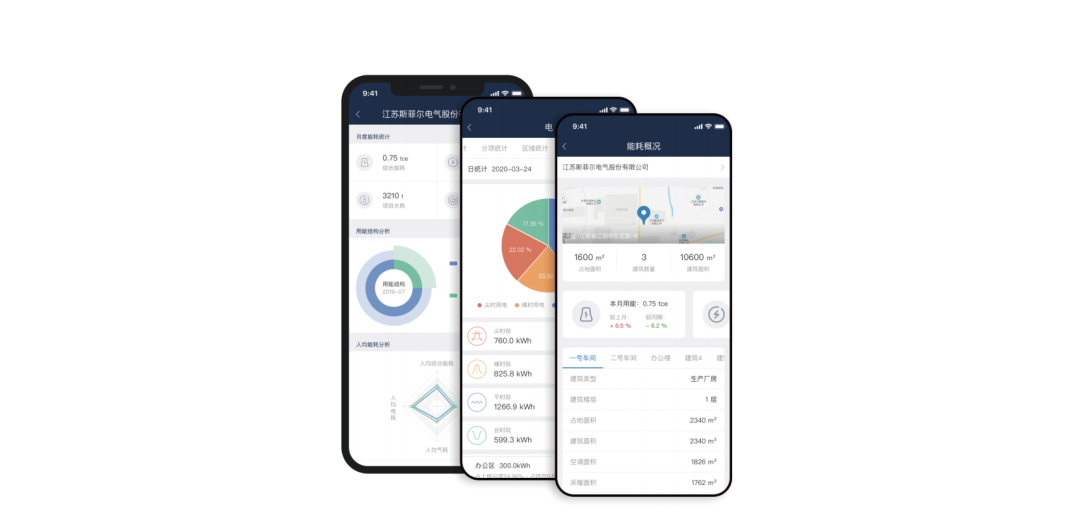
The APP organizes multiple energy management objects within the enterprise in the form of a map, presenting basic information, energy consumption statistics, and other information. It is convenient to query the basic information, energy consumption data, and related energy consumption analysis indicators of various energy management objects and regions.
Focus on energy consumption trends
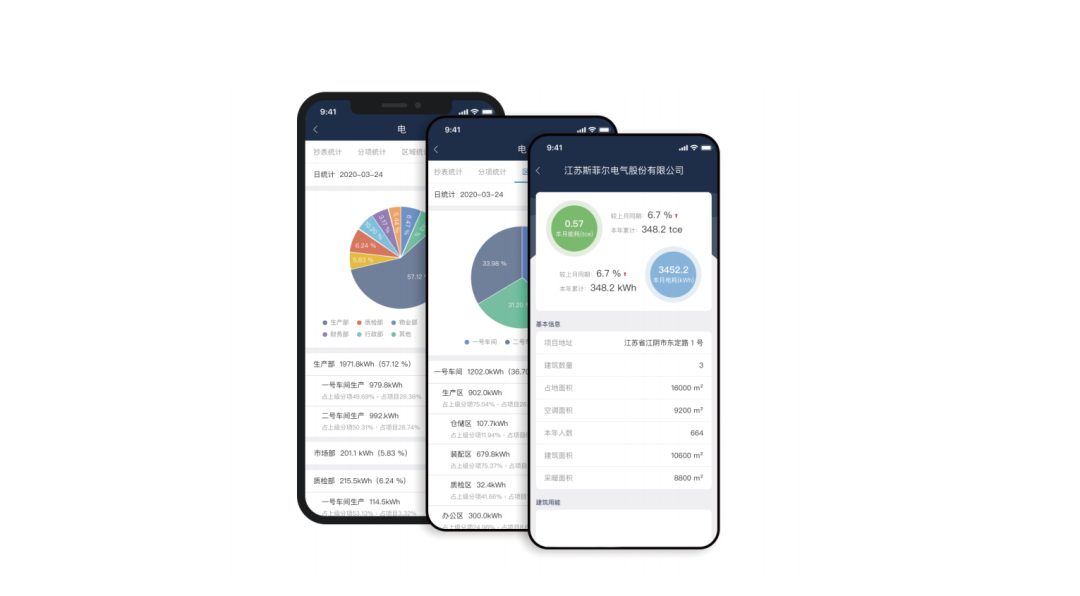
Comprehensively display the consumption statistics historical data of various energy sources in the project, presenting the historical trend of enterprise energy consumption utilization through various statistical dimensions such as sub regions and households, as well as energy consumption data model configuration information.
About Elecnova/Sfere Electric
Elecnova / Sfere Electric a leading manufacturer and solution provider of Power quality analyzer / Energy analyzer / kWh energy meter / Multi circuit power monitoring system / EV charger metering / Digital power meter / Motor controller / Busway temperature sensor / Harmonic Filter / Power factor correction / Low Voltage power distribution panel / Cloud view Power monitoring system.

































Copyright © 2019.Company Name All Rights Reserved.