.png?v=v1)
.png?v=v1)
2023.03.24
Industrial Overview
In recent years, many of the industrial power distribution systems, operating failures of LV switchgear caused by "temperature rising" account about 60% or more in the total failure rate of the LV power distribution facilities. When we looking at the cause of temperature rising fault ,it is a progressive consequence from partial temperature increasing to mechanical strength of the Busbar is decreasing,insulation performance of the Busbar decreasing,insulation breakdown eventually short circuit fault. It brings significant safety accident. In practice there are many reasons involved for the Busbar temperature raising as below
Over load,short circuit, harmonic etc
Poor heat dissipation,excessive dust accumulation,improper maintenance practices,
Busbar loose bolts, aging and loose of the moving contact spring,impurity of the Busbar materials
Surge breaker stuck by lightning and the other external impacts
The Busbar temperature monitoring system mainly solves the potential dangerous caused by those not being able to monitor the temperature of the power distribution swichgear in real time. In order to improve the use safety of the equipment, indicate the operating status of the equipment, and reduce the accident rate of the equipment. Monitor the temperature of the electrical conjunction points in the LV power distribution swichgear on the site to prevent excessive contact resistance and abnormal heating of the contacts due to factors such as oxidation, looseness, and dust during operation. Once the temperature is abnormal, it can respond to the alarm in time. Remind the operation and maintenance personnel to check the problems in time to avoid the occurrence of safety accidents and provide guarantee for the safe and stable operation of the substation.
1. Systematic structure
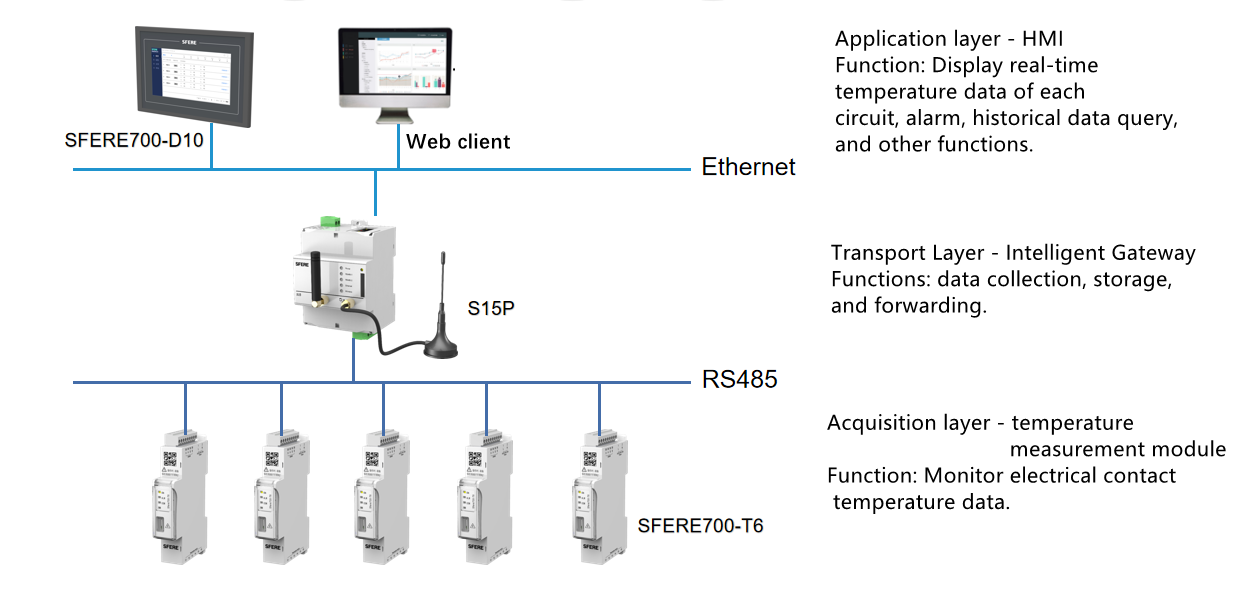
LV swichgear intelligent temperature monitoring system is combined by HMI, smart gateway and temperature monitoring modules. It performs the real time circuit breaker monitoring, temperature measuring electric conjunction points within the drawer cabinet,the smart gateway provides maximum 90days historical data storage including temperature raising trend, high temperature alarm,limit alarm etc. The user could also check the period temperature raising, average temperature and extreme temperature.
2. Temperature monitoring solution
Typical solution
Description
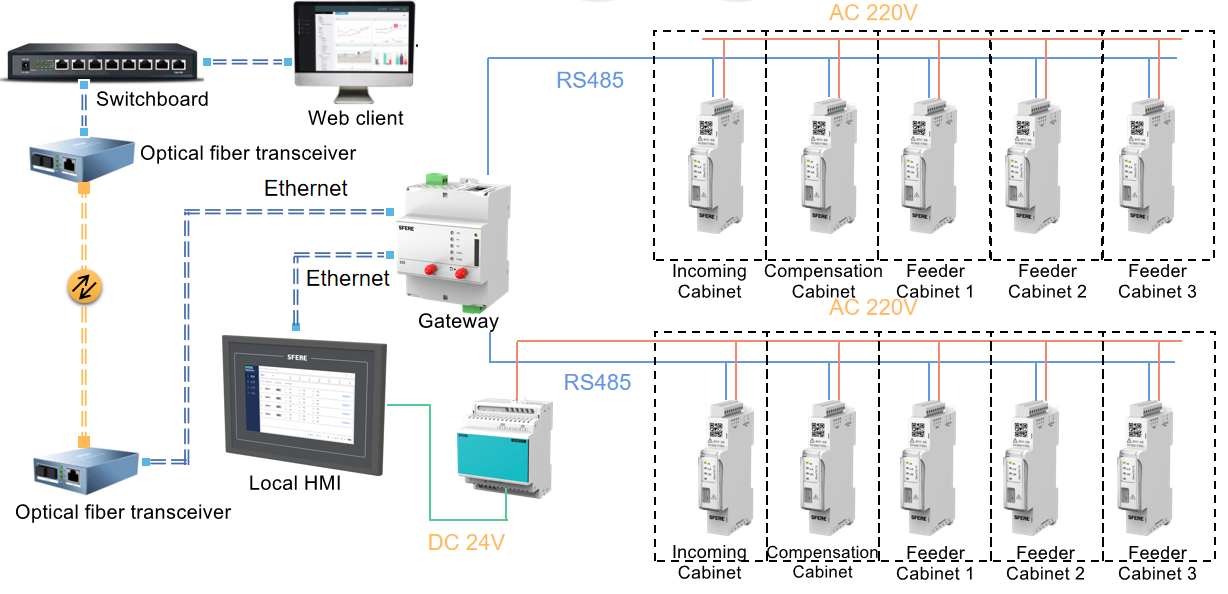
Temperature monitoring modules were distributed in each electric swichgears, real time monitoring the temperature incoming and outgoing junction points of Line A/B/C.the real time monitoring data would be send to the smart gateway by Modbus-RTU. There is a 10” HMI for local display or web server function by the smart gateway, the user could check the monitoring data such as temperature, real time/historical alarm,temperature curve etc on the PC or smart phone by login the IP address on the browser.
Configuration
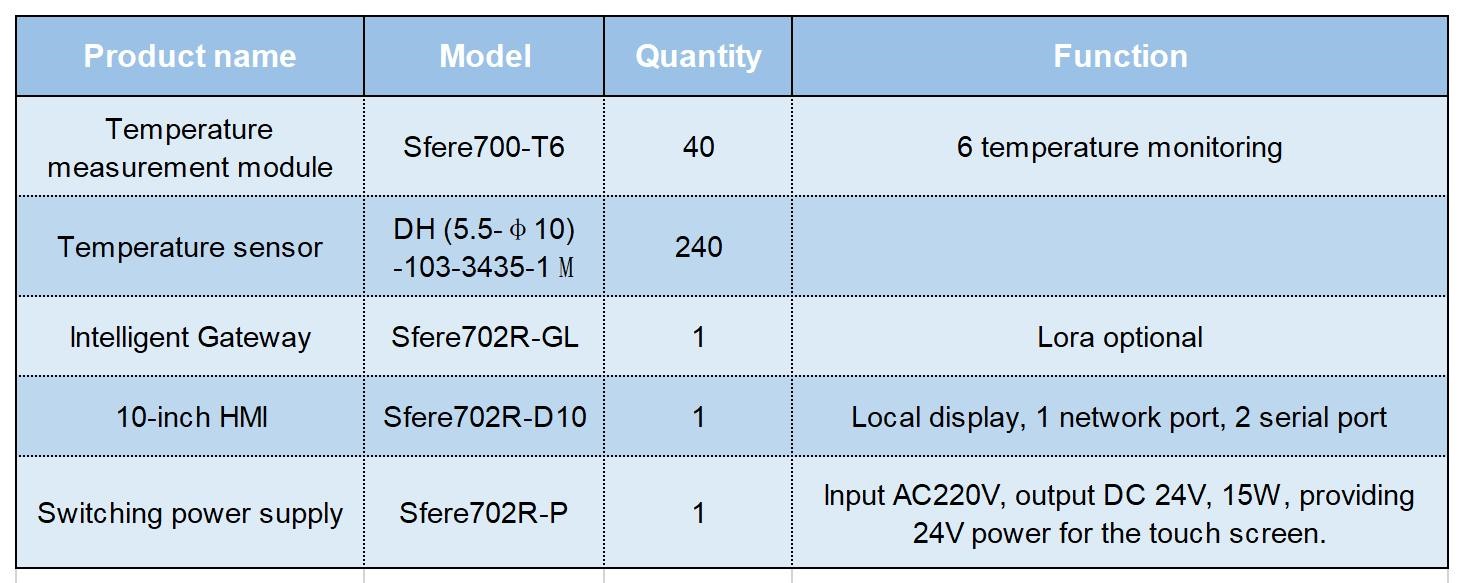
Implementation
Module installation type
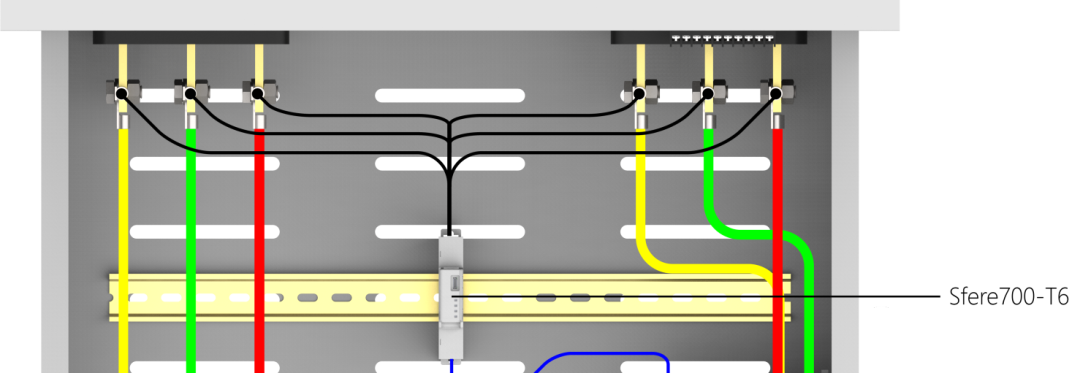
NTC installation type
Ring shape cold press cable open type

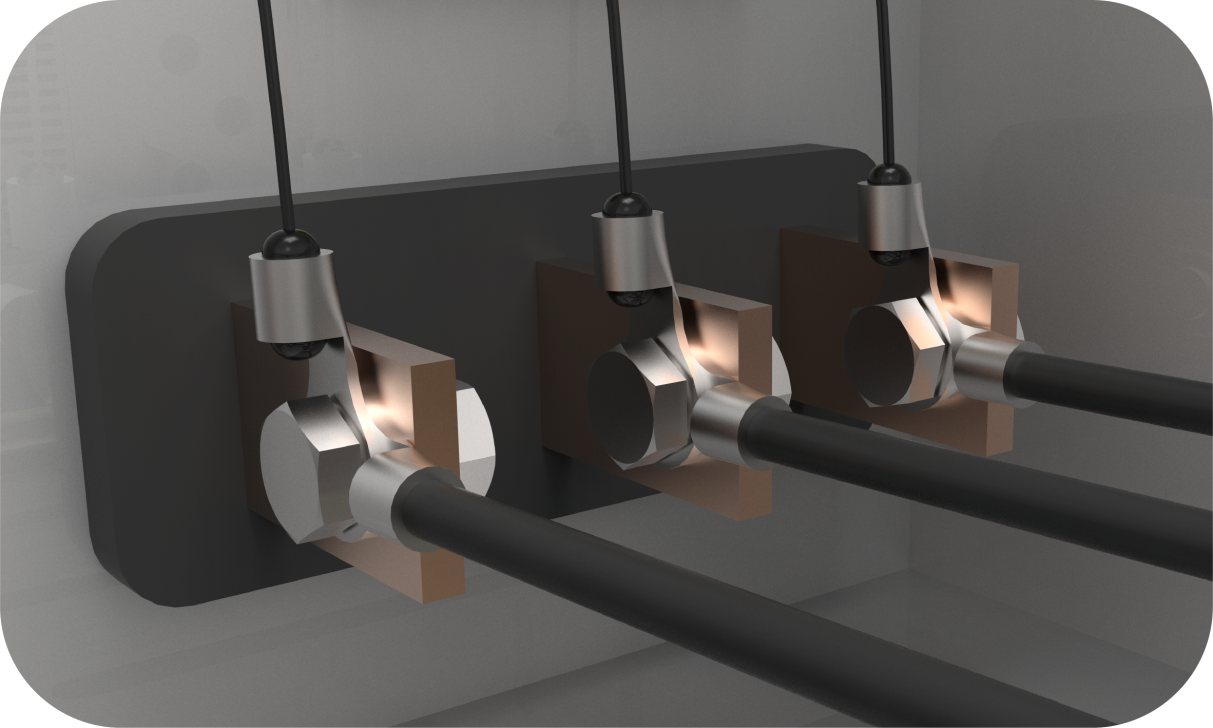
3. System functionality
Schematics
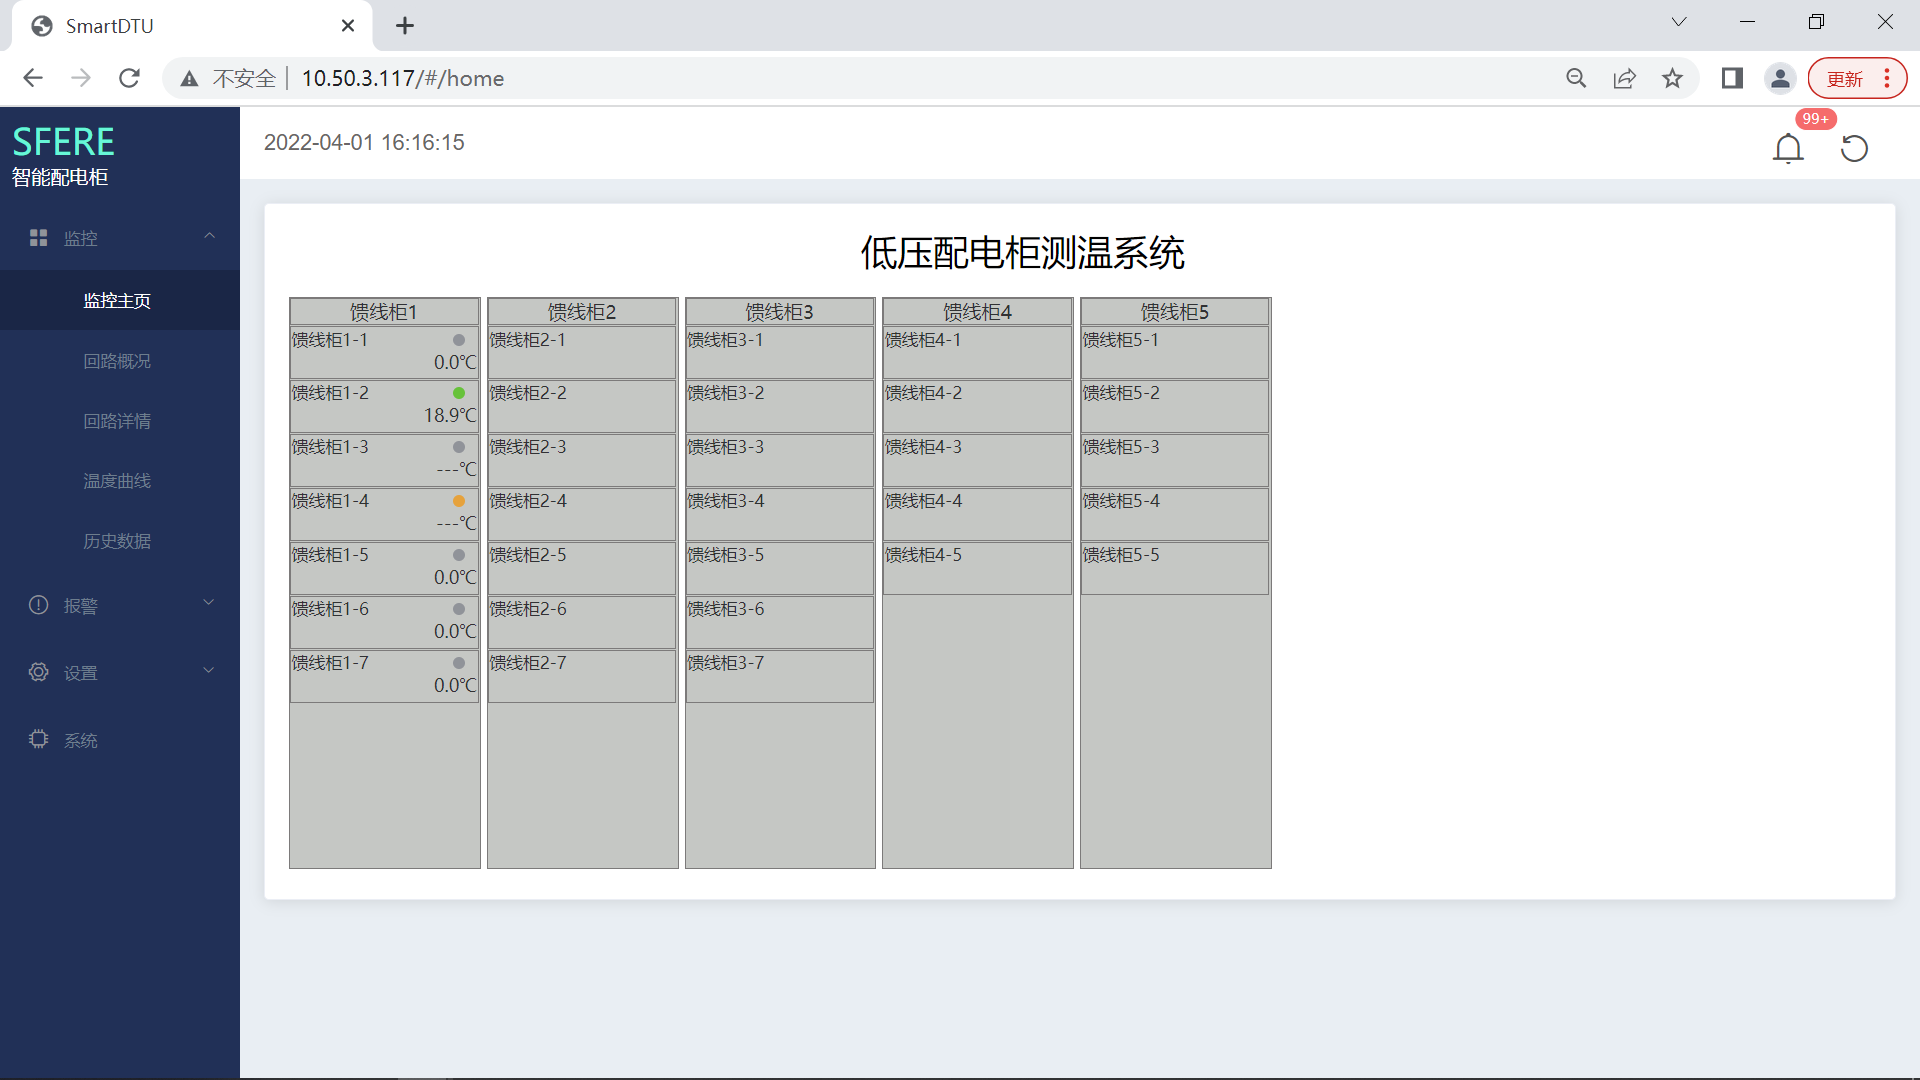
Circuit circumstance
Display the status and real-time temperature values of each monitoring point in the corresponding circuit in real time, and display them one by one according to the circuit name, status, and corresponding circuit.
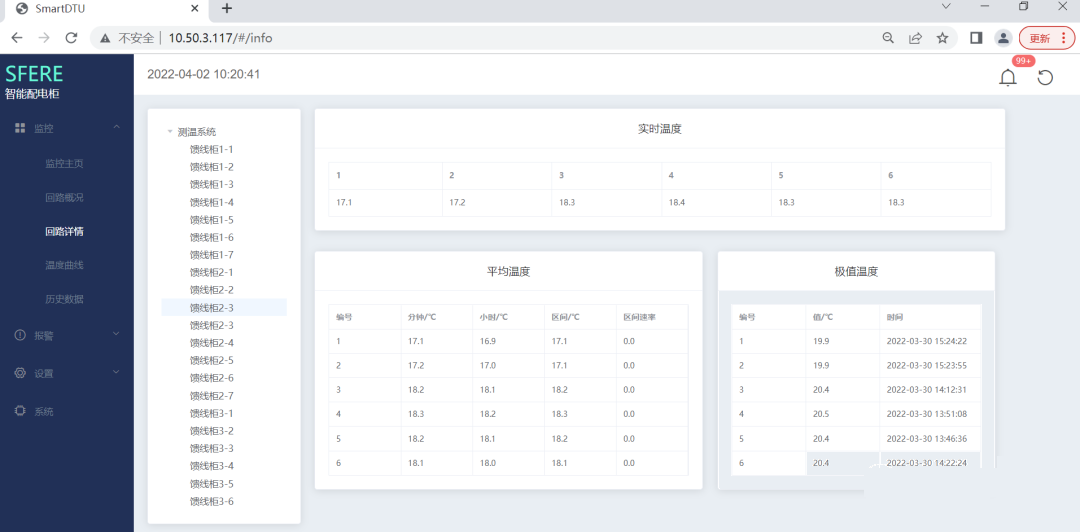
Circuit details
Real-time display of temperature values, average temperature per minute, average temperature per hour, interval temperature (interval time can be set), interval rate (corresponding temperature rise), extreme temperature (historical maximum), etc. at each monitoring point of the corresponding circuit.
Temperature curve
The temperature curve of the corresponding circuit can be queried to visually display the temperature trend. Query on time to obtain the temperature curve within 1 hour, query on a daily basis to obtain the temperature curve for 24 hours, query on a monthly basis to obtain the temperature curve within 30 days, and query on a yearly basis to obtain the temperature curve for 12 months.
Real time alarm
Display the alarm information of the device in real time to facilitate the timely detection of problems by customers. Each alarm is classified by color, and can be manually confirmed for recovery. Manual recovery requires filling in the confirmation details. In addition to manual alarm confirmation, it can also be restored by itself. After the alarm is restored, it is automatically saved to the historical alarm record.
Historical Alarm
Tracing a problem can query the cause of the fault, facilitating operation and maintenance personnel to analyze the problem and achieve closed-loop management. Historical alarms can be manually cleared, and false alarms or debugging alarm information can be deleted according to on-site operation and maintenance management needs.
4. Product Selection
Smart gateway
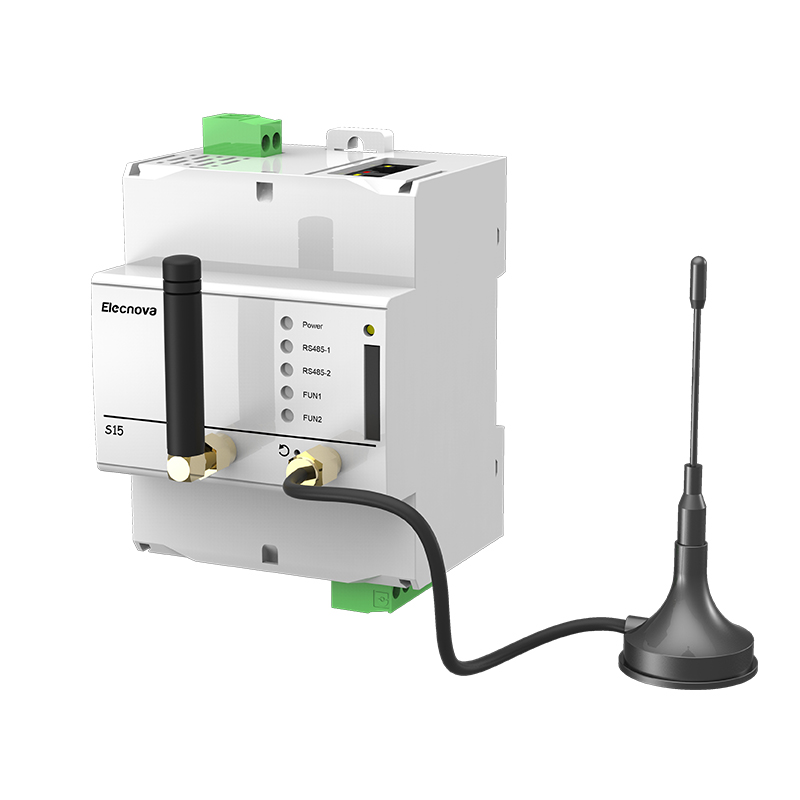
1. AC 220V power supply
2. Standard 35mm DIN rail
3. Two uplink RJ45 ports and two downlink RS485 ports
4. Optional communication interfaces such as LoRa, 4G, and WIFI
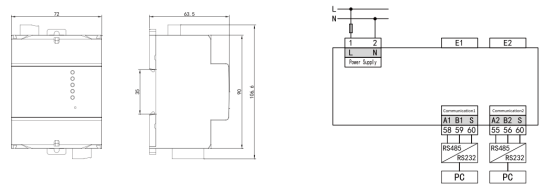
Temperature Module
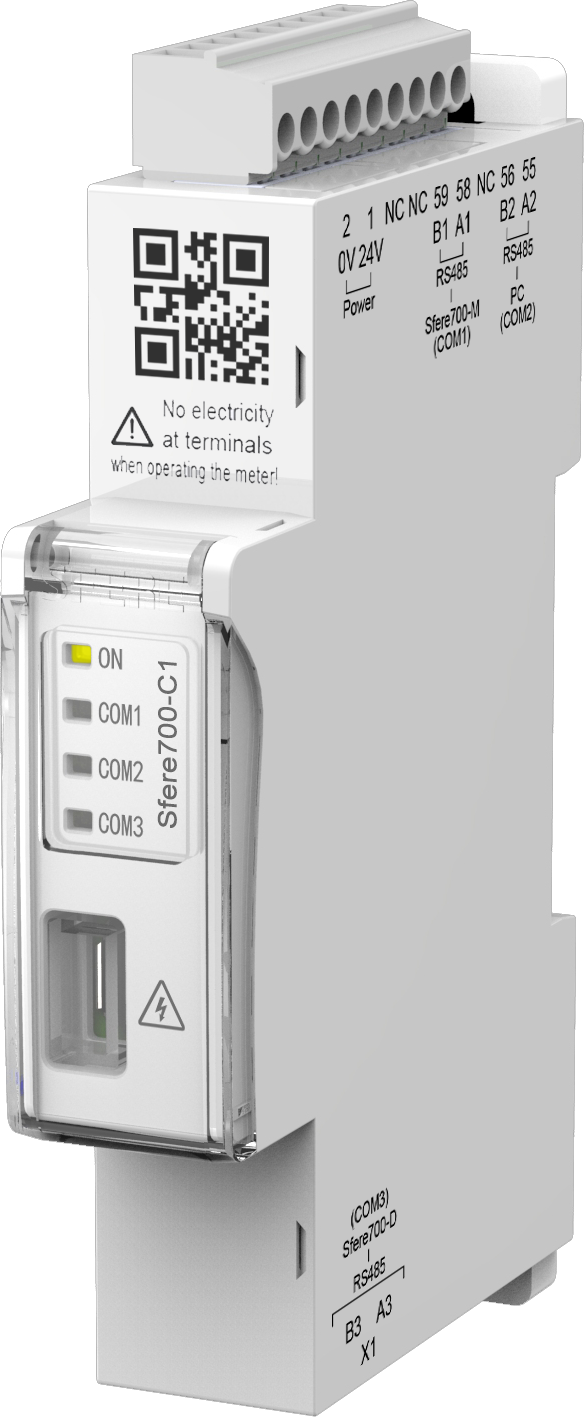
1. AC 220V power supply
2. 6 NTC
3. Measuring range: - 20℃~150℃, accuracy: ±1℃
HMI
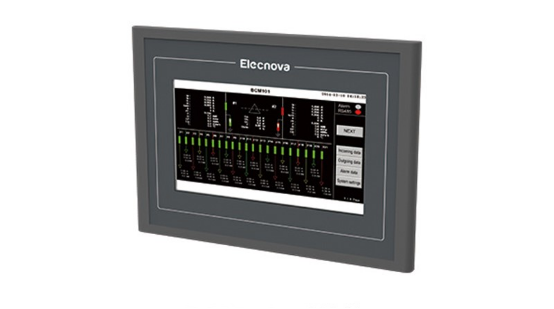
1. DC 24V power supply
2. 10.1 "TFT LCD screen, resolution 1024x600, LED backlight
3. Four wire resistive touch screen
4. 1 X RS232, 2 X RS485, 2 X USB (1 master and 1 slave), I X LAN

https://www.sfere-elec.net/product/S15-small-gateway-multiple-protocol-bus-device-79.html
Copyright © 2019.Company Name All Rights Reserved.